


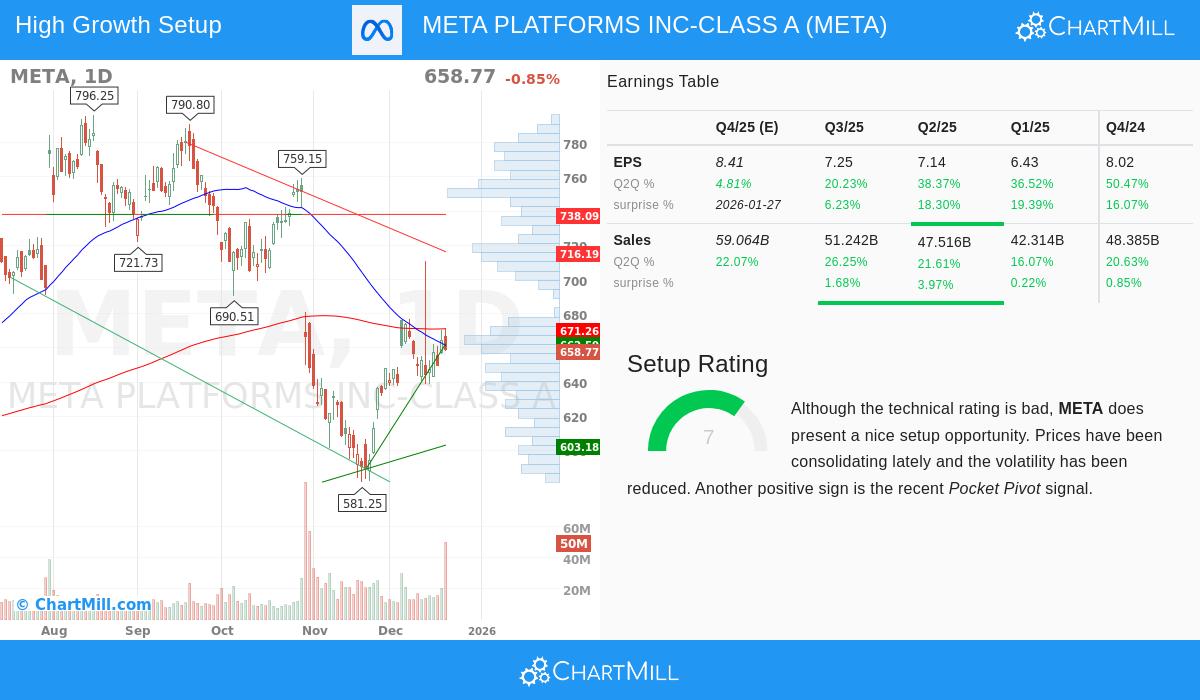
Recent Meta Platforms (META) stock chart illustrating price trends through late 2025.
Step 1: Understand the Business Model
Meta Platforms operates the Family of Apps (Facebook, Instagram, Messenger, WhatsApp) and Reality Labs (AR/VR).
Primary revenue (over 97%) comes from digital advertising, leveraging vast user data for targeted ads.
Daily active users exceed 3.2 billion, providing unmatched scale.
Emerging bets include AI tools and metaverse hardware, though Reality Labs remains loss-making.
Step 2: Review Financial Statements
Start with the latest quarterly report. In Q3 2025 (ended September 30), Meta reported:
- Revenue: $51.2 billion (up 26% YoY)
- Ad revenue: $50.1 billion (up 26%)
- Net income: Affected by one-time tax charge, but adjusted EPS strong
- Operating margin: 40%
Free cash flow supports massive investments while initiating dividends ($0.525 quarterly).
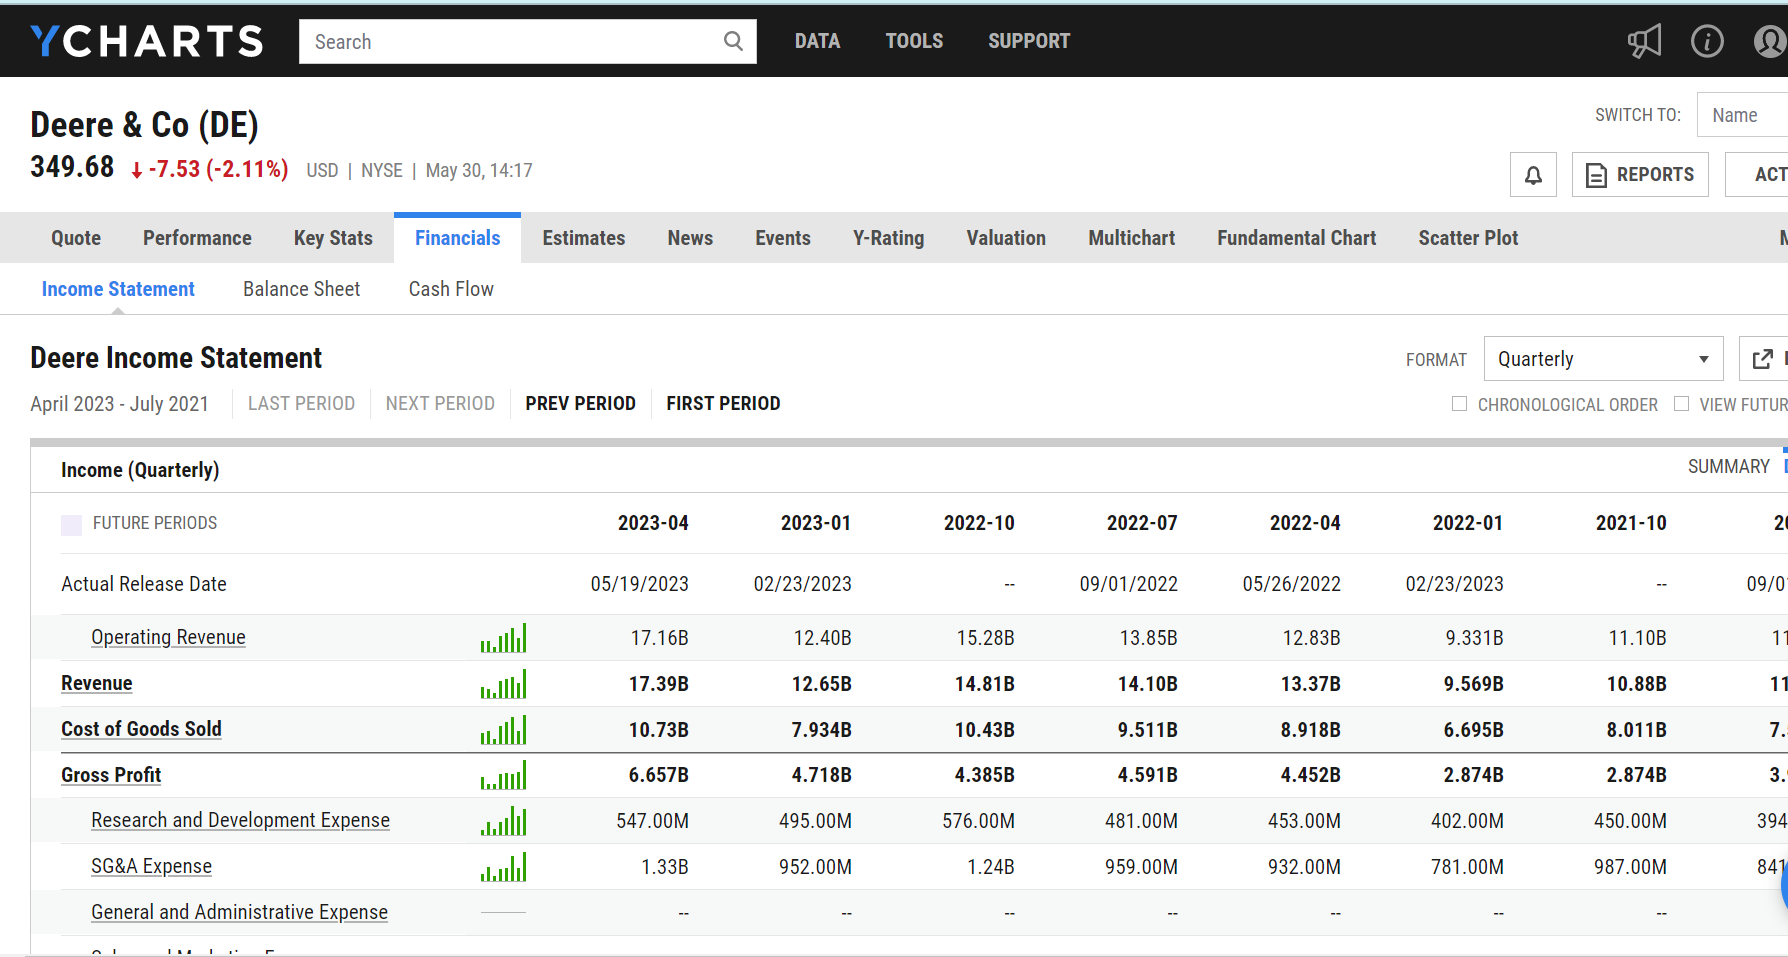
Overview of Meta Platforms’ recent income statement highlighting revenue growth.
Key Balance Sheet Items
Cash and equivalents: Robust position (~$44 billion recently).
Low debt relative to equity (D/E ~0.26).
Strong liquidity supports AI capex of $70-72 billion planned for 2025.
Step 3: Evaluate Key Financial Ratios
Current valuation (December 2025):
- Trailing P/E: ~29
- Forward P/E: ~22-24
- PEG ratio: ~1.3 (reasonable for growth stock)
- ROE: Over 30%
Compare to peers: Meta often trades at premium due to ad dominance but discount on AI uncertainty.
Step 4: Analyze Growth Drivers and Risks
Positive drivers:
- AI-enhanced ad targeting boosting revenue
- User growth in emerging markets
- Threads and Reels gaining traction
Risks:
- Heavy AI capex (expected higher in 2026) pressuring margins
- Regulatory scrutiny (EU privacy rulings, antitrust)
- Competition from TikTok, Google
Real-world example: Post-Q3 earnings, stock dipped on capex guidance but recovered on ad strength.

Mark Zuckerberg, Meta’s founder and CEO, driving AI and metaverse strategy.
Step 5: Technical Analysis
Examine charts for trends:
- 52-week range: ~$480 to $796
- Support levels: Around $600-650
- Resistance: Near all-time highs
- Moving averages: Monitor 50-day and 200-day for crossovers
Use tools like RSI for overbought/oversold signals.
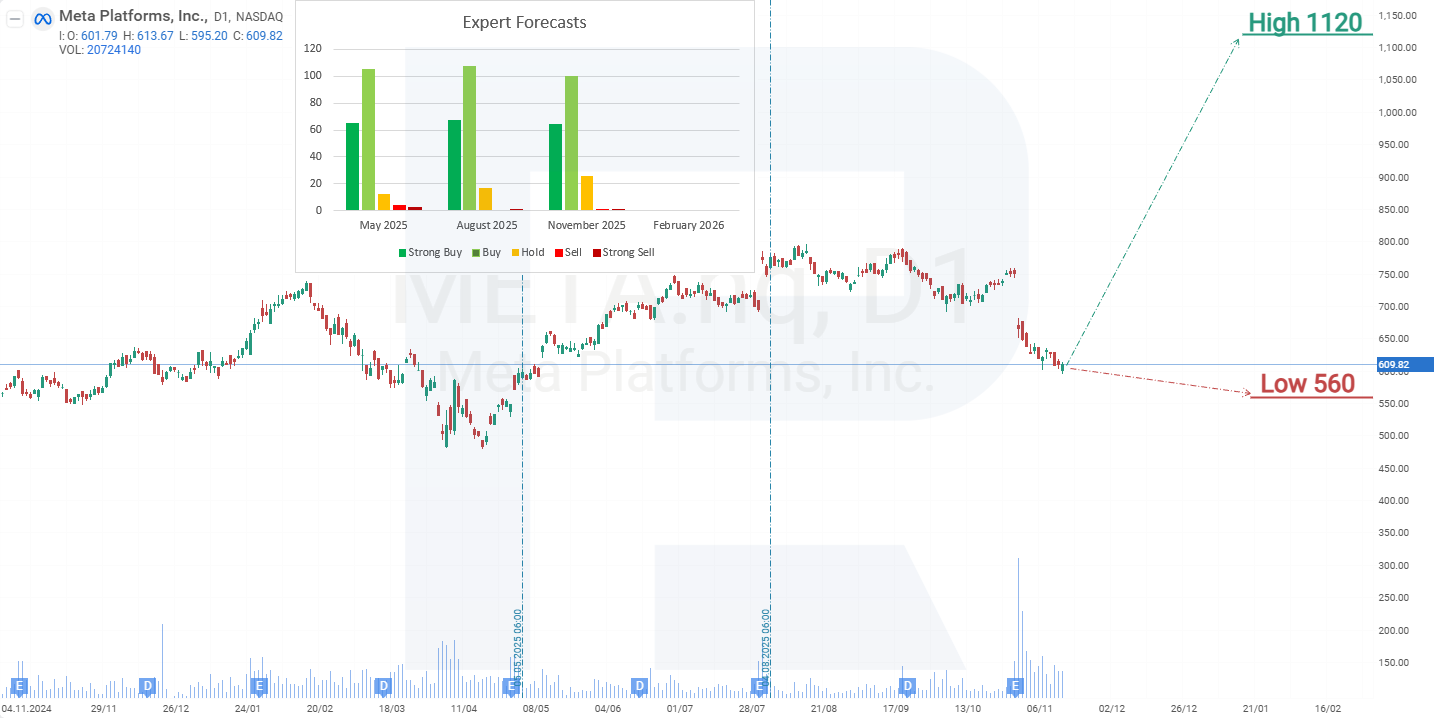
Technical indicators and price forecast chart for Meta Platforms.
Step 6: Check Analyst Opinions and Targets
Consensus (late 2025): Strong Buy
Average price target: ~$818 (potential 24% upside from $661)
High targets exceed $1,000 on AI optimism.
Source ratings from finance.yahoo.com.
Step 7: Consider Broader Market Factors
Interest rates impact ad spending.
Economic slowdowns reduce advertiser budgets.
Geopolitical events affect global user engagement.

Meta’s core apps: Facebook, Instagram, WhatsApp, and Messenger powering advertising revenue.
Final Investment Decision Framework
Diversify: Meta suits growth portfolios but avoid over-allocation.
Long-term hold: Strong for 5+ years given network effects.
Monitor quarterly: Watch capex vs. ROI on AI.
Consult resources like SEC filings at sec.gov.
Frequently Asked Questions
Is Meta stock undervalued in late 2025?
Forward P/E around 22-24 suggests reasonable valuation for growth, though capex raises short-term concerns.
What are Meta’s biggest risks?
Regulatory fines, AI spending without quick returns, and ad market slowdowns.
How much has Meta stock returned historically?
Strong long-term performer, with significant gains post-2022 recovery.
Should beginners invest in Meta?
Yes, as a stable mega-cap tech stock, but learn basics first.
When is Meta’s next earnings?
Typically late January for Q4; check investor relations.
Does Meta pay dividends?
Yes, initiated quarterly dividend in 2025 (~0.3% yield).


