


Example stock quote display for Meta Platforms (NASDAQ: META), highlighting essential data points for investors.
:max_bytes(150000):strip_icc()/what-is-a-ticker-symbol-356346_FINAL-79a10a40f6ed41ebb8a8714c93f398d8.png)
Visual explanation of stock ticker symbols, the unique identifiers for publicly traded companies.
Investing in stocks starts with understanding the basic information presented in a stock quote. Platforms like Yahoo Finance, Google Finance, or brokerage apps display this data in real-time or with slight delays.
A stock quote is more than just a price—it’s a comprehensive overview of trading activity and company valuation. We’ll use Meta Platforms, Inc. (META) throughout this guide, with data reflecting conditions as of December 23, 2025.
What Is a Stock Quote?
A stock quote summarizes current trading details for a specific security. It includes the latest price, changes, volume, and valuation metrics.
Quotes appear on financial websites, apps, and trading platforms. Free versions often show delayed data (15-20 minutes), while paid services provide real-time updates.
For beginners, starting with major sites like Yahoo Finance or Nasdaq.com is ideal.
Key Components of a Stock Quote
Ticker Symbol and Company Name
The ticker symbol is the abbreviated code identifying the stock. Meta Platforms trades as META on the NASDAQ exchange.
Tickers are typically 1-5 letters. The full company name usually appears alongside for clarity.
:max_bytes(150000):strip_icc()/Stocksymbol_final-f3db040647904407aed1efa106dec9a8.png)
Common stock ticker symbols and how they represent companies on exchanges.
Current Price and Change
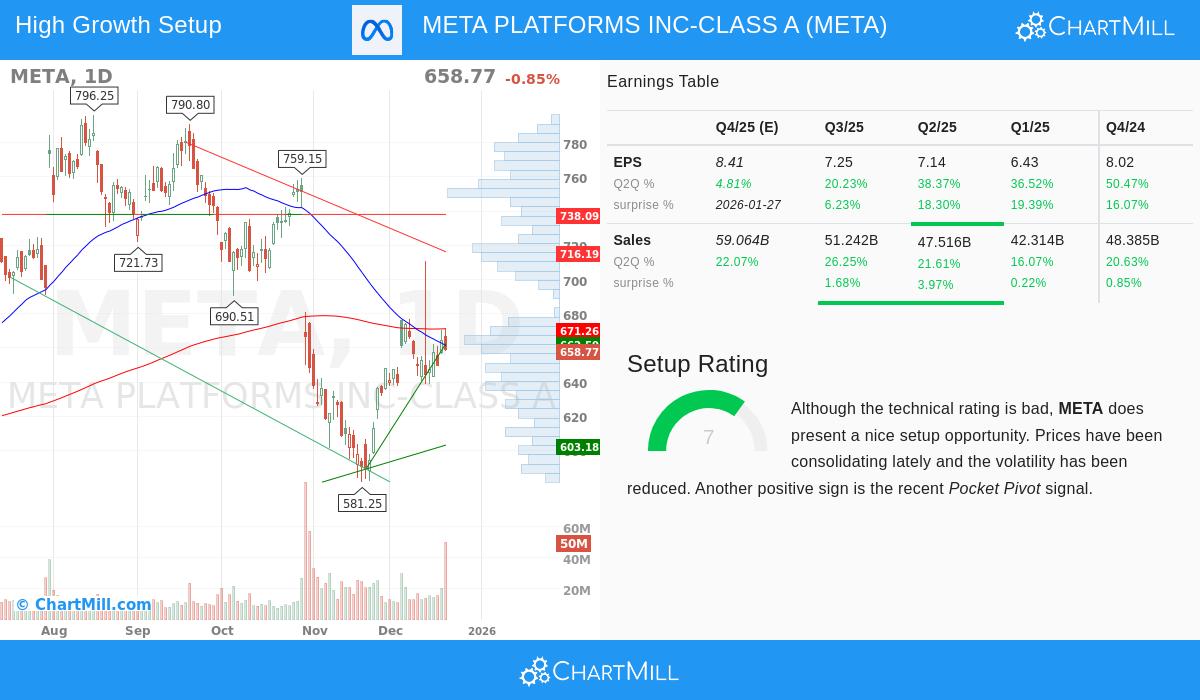
The most prominent figure is the last traded price. As of December 23, 2025, META’s price hovers around $670 per share.
Next to it, you’ll see the daily change in dollars and percentage. A green value indicates an increase; red shows a decrease.
For example, if META closes at $669.91 with a +$5.00 (+0.75%) change, it means the stock rose that amount from the previous close.
Bid and Ask Prices
The bid price is the highest amount buyers are willing to pay. The ask (or offer) is the lowest sellers accept.
The difference is the bid-ask spread. Narrow spreads indicate high liquidity, common in large-cap stocks like META.
Day’s Range and Volume
Day’s range shows the high and low prices during trading hours. META might range from $658 to $670 on a given day.
Volume is the number of shares traded. High volume (millions for META) confirms strong interest and validates price movements.

Example stock chart showing daily high, low, open, close, and volume bars for better understanding trends.
52-Week Range
This displays the highest and lowest prices over the past year. For META in 2025, the high reached approximately $796, with a low around $480.
It helps gauge if the current price is near highs (potentially overvalued) or lows (possible bargain).
Market Capitalization
Market cap is the total value of outstanding shares: current price multiplied by shares outstanding.
META’s market cap exceeds $1.6 trillion, classifying it as a mega-cap stock.
Categories include: small-cap (<$2B), mid-cap ($2-10B), large-cap (>$10B).
Valuation Metrics in a Stock Quote
Price-to-Earnings (P/E) Ratio
The P/E ratio divides the stock price by earnings per share (EPS) over the trailing 12 months.
A lower P/E may suggest undervaluation; higher indicates growth expectations. Tech stocks like META often have elevated P/Es due to future potential.
Earnings Per Share (EPS)
EPS measures profit allocated per share. Higher EPS generally signals stronger profitability.
Dividend Yield
Yield is annual dividends divided by price, expressed as a percentage.
META initiated dividends in recent years; check current yield for income potential.
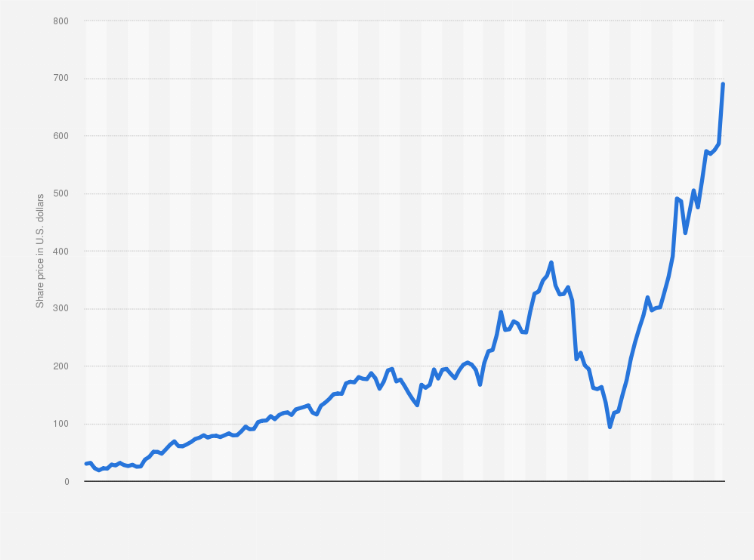
Meta Platforms (META) monthly share price performance in 2025, showing volatility and trends.
Putting It All Together: Meta Example
Imagine viewing META’s quote on December 23, 2025:
- Ticker: META (Meta Platforms, Inc.)
- Last Price: $670.00
- Change: +$8.00 (+1.21%)
- Volume: 15 million shares
- Market Cap: $1.68 trillion
- P/E Ratio: Around 28-30 (trailing)
- 52-Week Range: $480 – $796
This snapshot shows a large, liquid stock with solid daily activity and growth-oriented valuation.
Tips for Beginners
- Compare quotes across platforms for consistency.
- Use charts alongside quotes for visual context.
- Focus on trends over single-day fluctuations.
- Research beyond the quote—read company news and filings.
Practice by looking up various stocks daily. Over time, interpreting quotes becomes second nature.
Beginner-friendly breakdown of stock chart elements, complementing quote data.
Frequently Asked Questions
What does the stock quote price represent?
The price is the last amount at which shares traded. It fluctuates constantly during market hours based on supply and demand.
How is market cap calculated in a stock quote?
Market capitalization equals current share price multiplied by total outstanding shares, giving the company’s overall market value.
What is a good P/E ratio?
It varies by industry. Growth sectors like tech often exceed 25, while mature industries may be below 15. Compare to peers.
Why is volume important when reading a stock quote?
High volume indicates strong trader interest and makes price movements more reliable. Low volume can signal limited liquidity.
Does Meta pay dividends?
Yes, Meta began paying dividends in recent years. Check the latest yield in the quote for current income details.
Where can I find free stock quotes?
Reliable sources include Yahoo Finance, Google Finance, CNBC, and Nasdaq websites, offering comprehensive quote data.


