

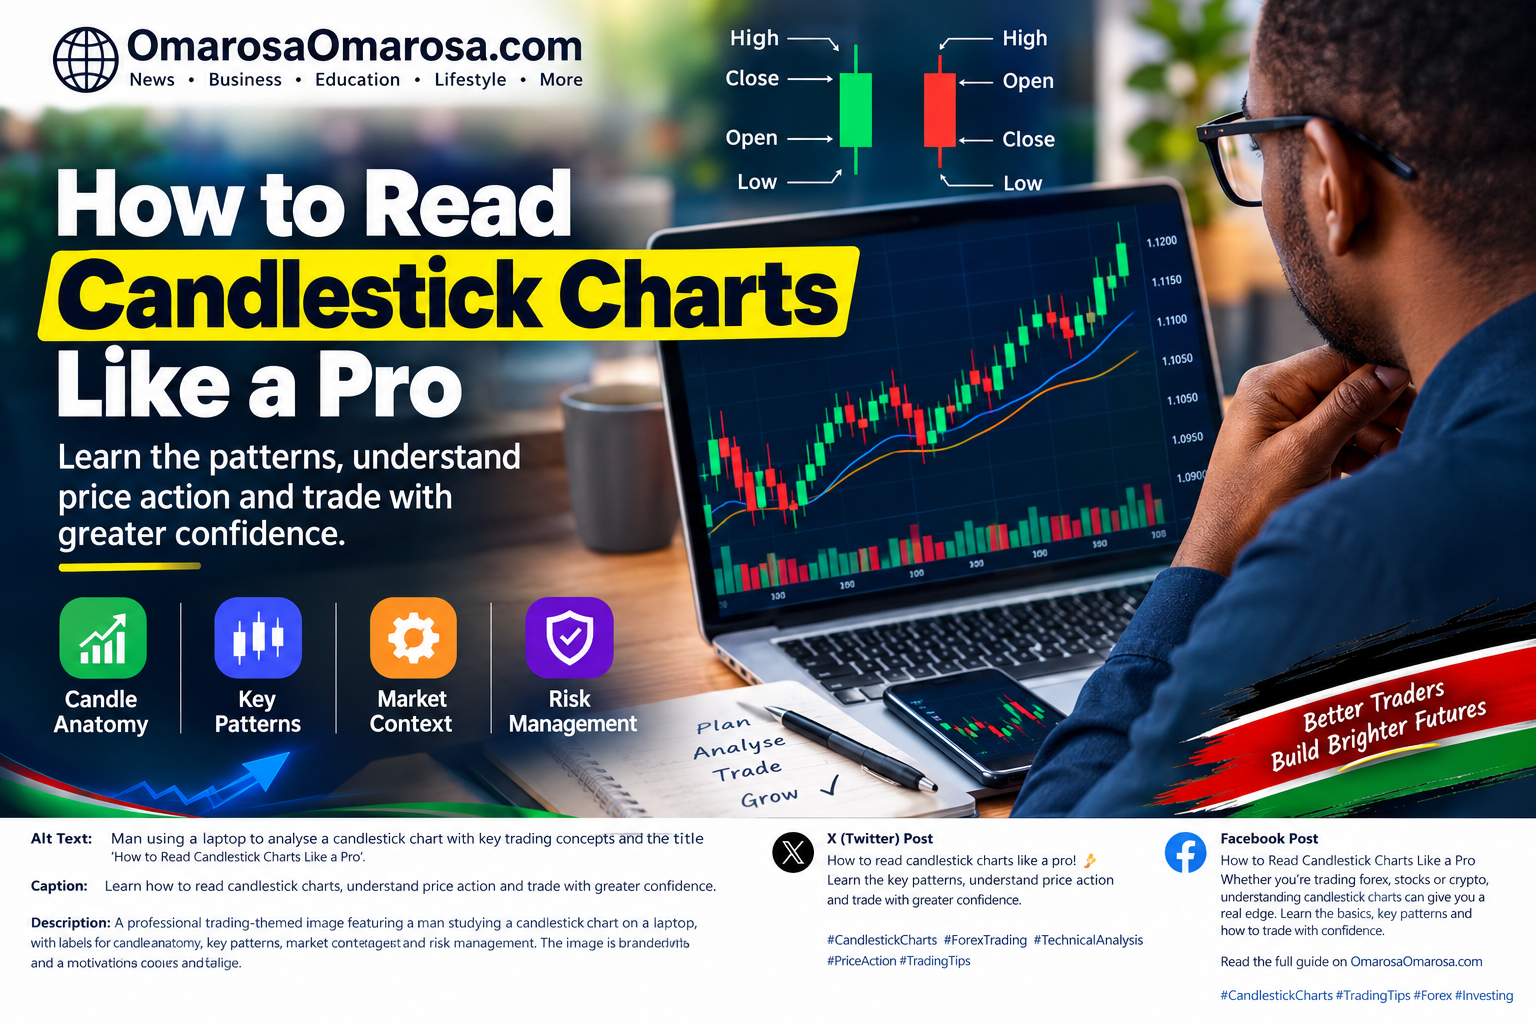
What if a single candle could tell you who was winning the battle between buyers and sellers?
That is essentially what a candlestick chart does. Instead of showing only where an asset finished, a candlestick captures the open, high, low and close for a selected period. Traders use that information to study price action, momentum, rejection and potential changes in market sentiment.
Knowing how to read candlestick charts can therefore give traders a much clearer picture of what happened during a trading session. But a candle should never be treated as a guaranteed prediction of what happens next. Candlestick analysis is most useful when combined with market structure, trend analysis, support and resistance, volume where available, and disciplined risk management.
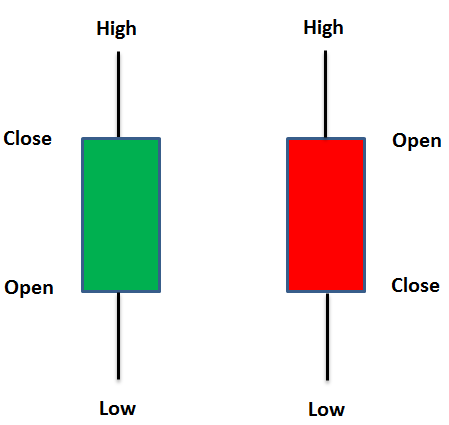
A candlestick displays four essential price points: open, high, low and close.
What Is a Candlestick Chart?
A candlestick chart is a graphical representation of price movement over a selected period. The period might be one minute, five minutes, one hour, one day, one week or another timeframe supported by your trading platform.
Each candle tells a small story about the market. It shows where price started, how far buyers pushed it, how far sellers pushed it and where the period ultimately ended.
This makes candlestick charts particularly useful for traders who want to study price action rather than relying exclusively on indicators.
Understanding the Four Parts of a Candlestick
The first step in learning how to read candlestick charts is understanding their anatomy.
1. Open
The open is the price at which the selected trading period began.
For example, on a daily chart, the opening price represents where the asset began trading during that particular daily candle.
2. Close
The close is the price at which the trading period ended.
The relationship between the open and close helps determine whether the candle was bullish or bearish.
3. High
The high represents the highest price reached during the candle’s timeframe.
4. Low
The low represents the lowest price reached during the same period.
These four values create the complete price story contained within one candlestick.
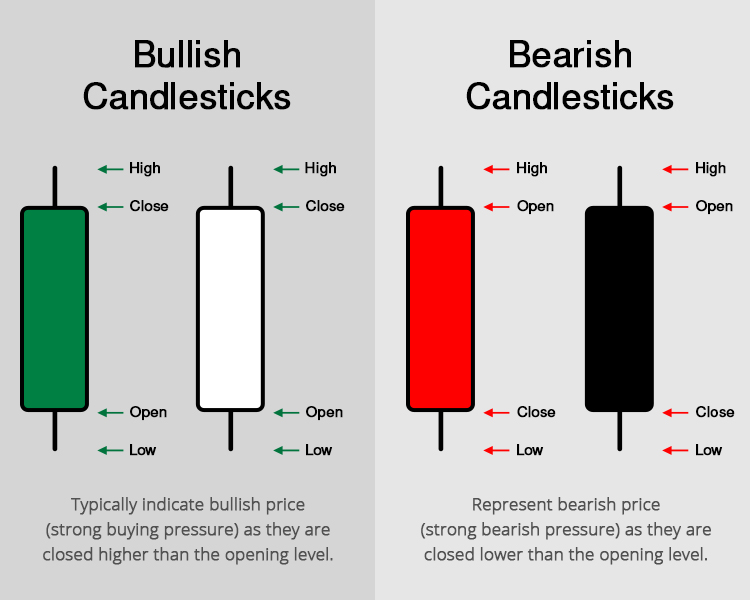
Bullish and bearish candles can reveal the balance between buying and selling pressure..
The Candle Body and the Wicks
A candlestick has two major visual components: the body and the wicks, also called shadows.
The body represents the distance between the opening and closing prices. The upper and lower wicks show the highest and lowest prices reached during that period.
A long body generally indicates a relatively large movement between the open and close. A small body suggests that the opening and closing prices were relatively close together.
The wicks can provide additional information. A long upper wick, for example, can show that buyers pushed price higher but sellers eventually forced it back down before the candle closed.
What a long wick can reveal
This is where the hidden information in candlesticks becomes important.
A long wick can represent price rejection. However, rejection does not automatically mean a reversal is coming. The surrounding market structure determines whether that rejection is meaningful.
A long upper wick near a major resistance zone may be more significant than an identical wick appearing randomly in the middle of a strong trend.
How to Read Bullish and Bearish Candles
On most trading platforms, bullish and bearish candles are displayed using contrasting colours, although traders can customise their charts.
A bullish candle closes above its opening price. A bearish candle closes below its opening price.
Consider this simplified example:
- Bullish candle: Open at 100, close at 108.
- Bearish candle: Open at 108, close at 100.
- Small-body candle: Open and close are relatively close together.
The important point is not simply the colour. The size of the body, length of the wicks and location of the candle on the chart all matter.
Why Context Matters More Than a Single Candle
One of the biggest mistakes beginners make when learning how to read candlestick charts is treating individual candles as standalone trading signals.
A Hammer appearing after a prolonged decline is different from a similar-looking candle appearing during a sideways market.
Likewise, a bearish-looking candle at a major resistance level may deserve more attention than the same candle appearing in the middle of an established uptrend.
Professional chart analysis therefore asks three questions:
- Where did the candle form?
- What happened before it appeared?
- Did subsequent price action confirm the signal?
Seven Candlestick Patterns Every Beginner Should Know
1. Doji
A Doji generally occurs when the opening and closing prices are very close together.
It can indicate indecision because neither buyers nor sellers managed to establish a decisive advantage during the period.
Important: A Doji does not automatically mean price will reverse.
2. Hammer
A Hammer typically has a relatively small body and a long lower wick.
When it appears after a decline and near meaningful support, traders may interpret it as evidence that sellers pushed price lower but buyers rejected those lower levels.
Confirmation is still important before treating it as a reversal signal.
3. Shooting Star
A Shooting Star generally features a small body with a long upper wick.
It can indicate that buyers pushed price higher before sellers regained control.
A Shooting Star near resistance can be particularly interesting to price-action traders.
4. Bullish Engulfing
A Bullish Engulfing pattern consists of a bearish candle followed by a larger bullish candle whose body covers the previous candle’s body.
It can indicate a shift in short-term buying pressure, particularly when it develops after a meaningful decline.
5. Bearish Engulfing
A Bearish Engulfing pattern is essentially the opposite. A bullish candle is followed by a larger bearish candle that covers the previous candle’s body.
When appearing after an extended rise or near resistance, it may signal increasing selling pressure.
6. Morning Star
The Morning Star is a multi-candle bullish reversal formation traditionally associated with a decline.
Traders generally examine the relationship between the candles rather than focusing on one candle independently.
7. Evening Star
The Evening Star is the bearish counterpart to the Morning Star and can appear after an upward movement.
As with all candlestick patterns, confirmation and market context are essential.
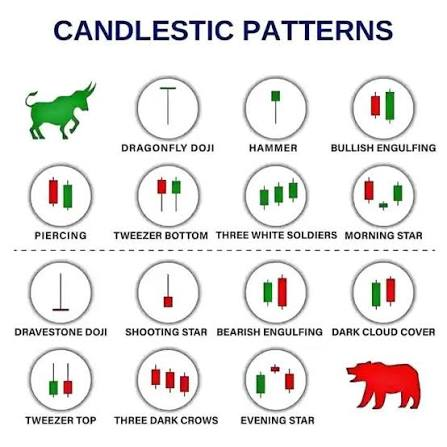
Common candlestick formations include Doji, Hammer, Shooting Star and Engulfing patterns.
How to Read Candlestick Charts Using Market Structure
Understanding individual patterns is useful, but professional analysis goes one step further by studying market structure.
Market structure describes the sequence of highs and lows formed by price.
An uptrend generally features higher highs and higher lows. A downtrend tends to produce lower highs and lower lows.
When you combine that structure with candlestick behaviour, individual candles become more informative.
For example, a bullish rejection candle at a higher low during an established uptrend may provide more useful information than a bullish candle appearing during a chaotic sideways market.
Support and Resistance: The Secret Behind Better Candle Reading
Support and resistance are among the most important concepts in technical analysis.
Support is an area where buying interest has historically helped prevent or slow further declines. Resistance is an area where selling pressure has historically restricted upward movement.
Candlestick signals that form around these areas can provide useful context.
For example, suppose EUR/USD approaches a well-established resistance level and forms a long upper wick. If subsequent candles begin closing lower, the rejection becomes more meaningful than the wick alone.
This is one of the most important lessons when learning how to read candlestick charts: location matters.
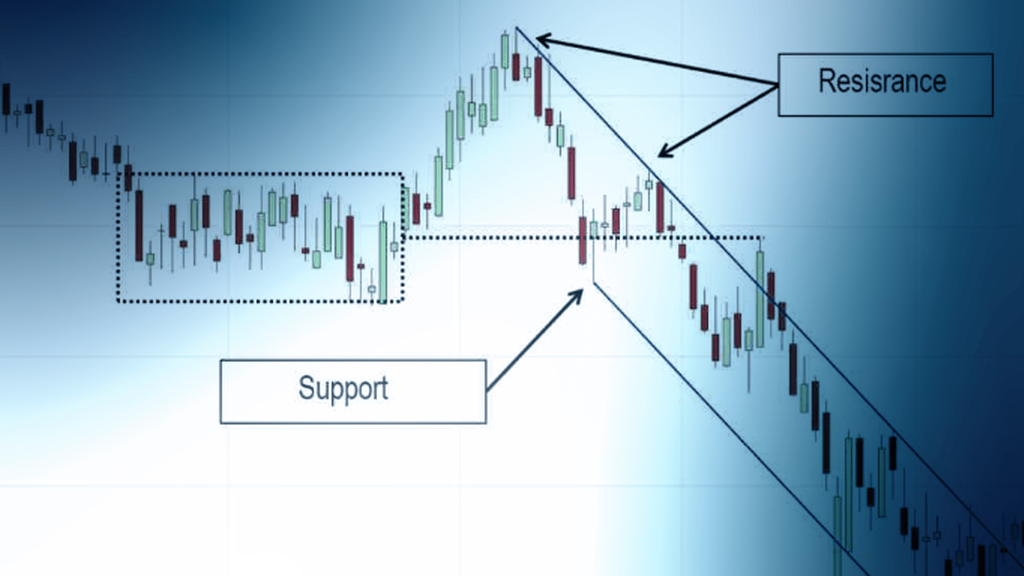
Combining candlestick behaviour with support and resistance can provide stronger market context.
Timeframes Can Completely Change the Picture
A candle on a five-minute chart tells a very different story from a candle on a daily chart.
This is why traders should avoid analysing one timeframe in isolation.
A practical approach is to use multiple timeframes:
- Higher timeframe: Identify the broader trend and important price zones.
- Middle timeframe: Study the developing market structure.
- Lower timeframe: Look for potential entry confirmation.
For example, a trader might identify an uptrend on the daily chart, locate support on the four-hour chart and then wait for a bullish price-action signal on the one-hour chart.
This approach can reduce the temptation to trade every candle that appears.
Volume Can Add Another Layer of Confirmation
When volume data is available, it can provide additional context for price movements.
A large bullish candle accompanied by unusually strong volume may indicate significant participation. However, volume should not be interpreted mechanically because its meaning varies across markets.
Forex traders, for example, often work with tick-volume data on retail platforms, while exchange-traded stocks provide centralised exchange volume.
The truth is that no single indicator or candle pattern can eliminate uncertainty from trading.
Common Candlestick Reading Mistakes
Even traders who know dozens of patterns can make serious mistakes.
Mistake 1: Memorising patterns without understanding context
Knowing the name of a candle does not tell you whether it represents a high-quality trading opportunity.
Mistake 2: Entering before confirmation
A potential reversal candle is not the same thing as a confirmed reversal.
Waiting for subsequent price action can help reduce false signals.
Mistake 3: Ignoring the trend
Trading every reversal pattern against a powerful trend can expose an account to unnecessary losses.
Mistake 4: Using too many indicators
Adding RSI, MACD, moving averages, Bollinger Bands and numerous other indicators does not automatically make analysis better.
Sometimes a clean chart with price structure, key levels and disciplined risk management provides more useful information.
Mistake 5: Treating candlesticks as predictions
Candlestick analysis identifies probabilities and market behaviour. It does not provide certainty.
A Simple Professional Process for Reading Any Candlestick Chart
If you are wondering how to read candlestick charts without becoming overwhelmed by dozens of patterns, use a structured process.
- Identify the timeframe. Know whether you are analysing minutes, hours, days or weeks.
- Determine the trend. Look for higher highs and higher lows or lower highs and lower lows.
- Mark key levels. Identify support and resistance.
- Examine the latest candles. Study body size, wick length and closing location.
- Look for a recognised pattern. Consider Doji, Hammer, Engulfing and other formations.
- Wait for confirmation. Avoid assuming that the first signal must succeed.
- Define risk before entering. Know where the trade is invalidated and how much you are willing to lose.
This process is far more reliable than scrolling through a chart looking for familiar candle shapes.
Did You Know Candlestick Patterns Are Only One Part of Technical Analysis?
Technical analysis can incorporate price charts, indicators, volume, volatility, momentum and support or resistance. Candlestick patterns are therefore best viewed as one component of a broader analytical framework.
Fidelity’s educational material similarly describes technical analysis as the study of charts, patterns and indicators to understand trends and price behaviour. :contentReference[oaicite:0]{index=0}
Its charting guidance also notes that each candlestick represents open, high, low and close for the selected timeframe. :contentReference[oaicite:1]{index=1}
That distinction is important because beginners sometimes expect a single pattern to provide an automatic buy or sell instruction.
How Professionals Think About Candlestick Signals
Professional traders generally think in terms of probabilities rather than certainty.
Instead of asking, “Will this Hammer make price rise?” a better question is:
“Does this Hammer provide evidence that improves the probability of a bullish scenario, given the trend, market structure, key levels and risk-to-reward profile?”
That change in thinking can dramatically improve decision-making.
A candle is evidence—not a guarantee.
Risk Management Still Comes First
Even the strongest-looking candlestick setup can fail.
Markets can react unexpectedly to economic releases, geopolitical events, central-bank decisions, earnings announcements and sudden changes in liquidity.
For that reason, traders should define risk before entering a position.
- Determine the maximum amount you are prepared to lose.
- Define the invalidation level for the setup.
- Consider position size before entering.
- Avoid increasing risk simply because a trade moves against you.
- Do not assume that a high-probability setup is a guaranteed setup.
Technical analysis should support risk management—not replace it.
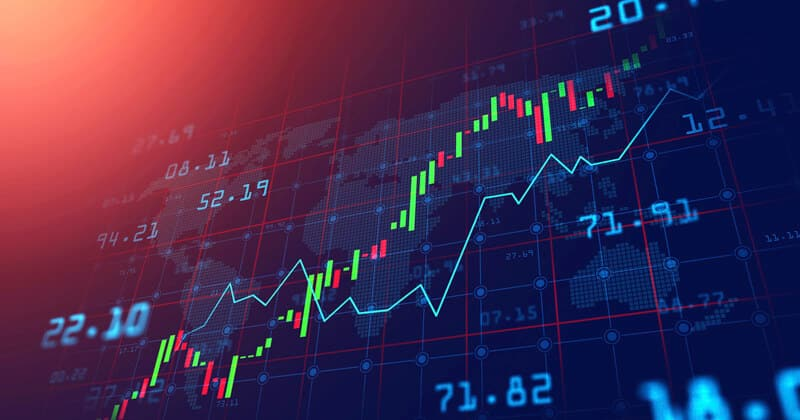
Effective candlestick analysis combines price action with market structure and disciplined risk management
Frequently Asked Questions
1. What is the easiest way to learn how to read candlestick charts?
Start by learning the four price points—open, high, low and close. Then understand candle bodies and wicks before studying common patterns such as Doji, Hammer and Engulfing formations. Finally, practise reading candles within trends and around support and resistance.
2. What does a long wick mean on a candlestick?
A long wick indicates that price travelled significantly in that direction during the timeframe but did not remain there by the close. It can suggest rejection, although its meaning depends heavily on the surrounding market structure.
3. Is a Doji a buy or sell signal?
Not by itself. A Doji generally represents indecision. Traders should examine where it formed, the preceding trend and subsequent price action before making a trading decision.
4. Which candlestick pattern is the most reliable?
No candlestick pattern is universally reliable. A pattern’s usefulness depends on market conditions, timeframe, location, trend and confirmation. Candlestick patterns should be treated as probability-based tools rather than guarantees.
5. Should beginners trade candlestick patterns?
Beginners can study and practise candlestick patterns, but they should understand risk management before using real money. Paper trading or a demo account can provide a safer environment for learning how patterns behave in different market conditions.
6. Can candlestick charts be used for forex and stocks?
Yes. Candlestick charts are widely used across financial markets, including forex, stocks, commodities, indices and cryptocurrencies. The principles of interpreting open, high, low and close remain broadly applicable, although market-specific characteristics can affect how signals should be interpreted.
Start Reading the Market, Not Just the Candles
The biggest lesson from how to read candlestick charts is that successful chart analysis is not about memorising the largest number of formations.
It is about understanding what price is communicating.
Study the trend. Identify important levels. Examine the candle’s body and wicks. Look for confirmation. Then manage your risk.
The secret is consistency: a trader who understands context can often extract more information from a simple chart than a beginner using dozens of indicators.
Start with one market, one or two timeframes and a small number of high-quality setups. Keep a trading journal and record what happened before and after each pattern. Over time, this can help you distinguish meaningful price action from market noise.
Ready to improve your trading knowledge? Bookmark this guide, practise identifying candlestick formations on historical charts and continue learning technical analysis before putting capital at risk.